
Infrared Spectroscopy
Nature of light
Most chemistry instruments use light as a means to gather information about chemical compounds. Some light we can see, other light is invisible. There are gamma rays, X-rays, ultraviolet light, visible light with its colors of the rainbow, infrared light, microwaves, AM/FM radio waves. All of these are light waves and travel at the speed of light (c = 3E8 m/s) in a vacuum. They all vary by wavelength and frequency of the light. A light wave can be described by its wavelength (λ) and frequency (ν).

Wavelength

Various Wavelengths of the Light Spectrum
The distance between the peaks of the waves is the wavelength of the light. This is a distance, so it is usually measured in a unit like meters or nanometers. Since all types of light travel at the speed of light, we could also count how many waves cross a point in one second. This number of waves that pass by in one second is called the frequency. It is written as a #/second. Sometimes the unit is written as s^-1 which is also called Hz (Hertz). Wavelength and frequency are inversely related to each other. The longer the wavelength, the lower the frequency. This is because, with long wavelengths, fewer waves can pass by in one second. The product of the wavelength and the frequency is equal to the speed of light, c. The speed of light in a vacuum is 3E8 m/s.

The energy of a light wave is directly proportional to the frequency. Planck’s constant (h = 6.63E-34Js) is the constant of proportionality. So, the higher the frequency of a light wave, the greater its energy is.

Springs
If a spring is pulled and released, it vibrates at differing resonance frequencies depending on the strength of the spring (the spring constant) and the masses of the weights attached to it. A stiff spring (a high spring constant) vibrates faster. A loose spring (a low spring constant) vibrates slower. If a spring has high masses attached, it vibrates slowly. If it has low masses attached, it vibrates faster. A molecular bond can be thought of as a tiny spring with two weights (atoms) on it. So, molecular bonds vibrate very fast with very light atoms like hydrogens on it. Bonds with heavier atoms, C, O, or N vibrate slower. Stronger triple bonds vibrate faster than weaker double bonds which vibrate faster than even weaker single bonds.
Infrared light (IR)
Infrared light is below visible red light in energy. Infra is Latin for “below”. IR light has a longer wavelength than visible light. Infrared light is heat light. Infrared goggles can see the heat emanating from people at night. The infrared part of the spectrum of the light coming from the sun is what warms us. The reason infrared light is the heat light is that infrared light is the correct frequency of light to cause molecules to vibrate. The vibration of molecules gives us heat. For molecules, when the correct vibrational frequency of infrared light hits a molecule and matches the resonance vibrational frequency of the bond, the bond begins to vibrate.
In infrared spectroscopy, the light waves are described by their wavenumber (ṽ). Wavenumbers are the inverse of the light’s wavelength, 1/λ. Usually, this is a measurement of how many waves are in one centimeter of space. It is written as #/cm or cm^-1 (inverse centimeters or reciprocal centimeters). The higher the wavenumber of light, the more waves fit into one centimeter. The higher the wavenumber of light, the shorter the wavelength of the light must be. The higher the wavenumber of light, the greater its frequency must be. The higher the wavenumber of light, the greater the energy light wave has. Read this paragraph again, slowly. Make sure you understand why each of the statements is true.
A typical infrared spectrum is 4000-400 cm^-1. A molecular bond vibrates when the correct frequency of infrared light hits it. Below is the general area for various bond vibrations in the IR spectrum.

General area for bond vibrations
Fingerprint region
The area of an infrared spectrum below 1400 cm-1 is called the fingerprint region. It is so named because this area is unique for every compound (its fingerprint). Even though there are some identifiable peaks in this area, there are extra peaks that are difficult to identify. Therefore, we spend most of our time identifying the peaks above 1400 cm-1 and then look down into the fingerprint region secondarily.
Stretching of the bond causes most of the peaks we will identify. The “extra” peaks that are in the fingerprint region that we usually don’t bother identifying are bending, rocking, wagging, scissoring, and twisting. There is more than one way for the molecule to vibrate and absorb infrared radiation. Do not worry about trying to memorize these.

Example of scissoring
Identifying IR peaks
We do need to memorize the most commonly seen peaks in an infrared spectrum. This task may appear overwhelming at first, but you can do it. It takes a lot of practice. The following chart is your lifeline to IR spectroscopy. Use it at first to identify the major peaks in your spectrum. When you identify a peak, look at the letter above the peak, and read the extra information about it below the chart. After a while, begin to try to solve the problems without looking at the chart.

A. O-H (alcohol). Usually very broad and strong. You should also see the C-O stretch at O. BEWARE: A small amount of water in the sample will give a small OH absorption.
B. N-H (amine). Broad and with one spike for one N-H bond. Usually two humps for two N-H bonds in NH2.
C. C-H for a terminal alkyne. It is a sharp peak and will show up only if the C≡C peak at I shows up.
D. C-H on an sp2 carbon. This could be on an aromatic ring or regular C=C. Greater than 3000 cm-1.
E. C-H on an sp3 carbon. Also called aliphatic C-H. Less than 3000 cm-1.
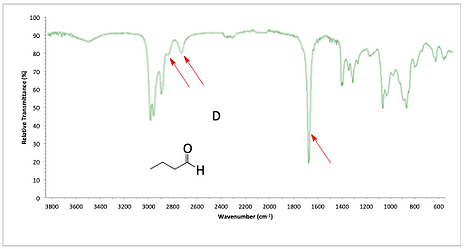
F. Aldehyde C-H peak. You must have both peaks around 2700, 2800 and the C=O peak at K.
G. O-H (carboxylic acid). A broad peak usually centered around 3000 and trailing off to the right. Notice how this is different than the O-H of an alcohol at peak A.
H. C≡N (nitrile). Right above 2200cm-1. BEWARE: CO2 absorbs at 2350 cm-1 and is a common contaminant if you do not carefully obtain your IR spectrum.
I. C≡C (alkyne). Right below 2200cm-1. Weaker. Usually will not see if it is not a terminal alkyne, so also look for the peak at C.
J. Aromatic overtones. Very characteristic of aromatic compounds. Their absence does not preclude an aromatic ring, though. Usually will have peak D with it.
K. C=O (carbonyl). Very strong.
1730’s for ester (look for ester peaks at 1250 and 1050) or a ring strained ketone (like cyclobutanone)
1720’s for aldehyde (look for aldehyde peaks at 2710, 2810)
1700-1720 for regular C=O (ketones, carboxylic acids). Look for the broad peak, G, to confirm the carboxylic acid OH.
1680’s is a conjugated carbonyl, O=C-C=C. Look for peak L.
1660’s is an amide, O=C-N. If N-H bonds are on the nitrogen of the amide, you can see them at B.
L. C=C. Regular alkene. Weaker than C=O peaks. Usually will have peak D with it. Will be absent or very small for internal C=C bonds.
M. NO2 (nitro) Two strong peaks that surround 1400 will be present for a nitro group. They must both be there.
N. Ester. If have an ester, will also have high carbonyl for K and the C-O bond around 1050.
O. C-O. Will see this in esters, alcohols, ethers, and carboxylic acids.
IR Chart
Alkanes, Alkenes, Alkynes
Hexane has all single bonds. The sp3 C-H bonds show a strong absorbance below 3000 cm-1. Go back to the chart on the previous page and locate the sp3 CH peak below 3000 cm-1 and compare it to the peak in the IR spectrum for hexane below. As you begin to learn these IR peaks, keep going back to the chart on the previous page to identify the peaks and begin memorizing them. You will need to know the locations of all of these peaks!
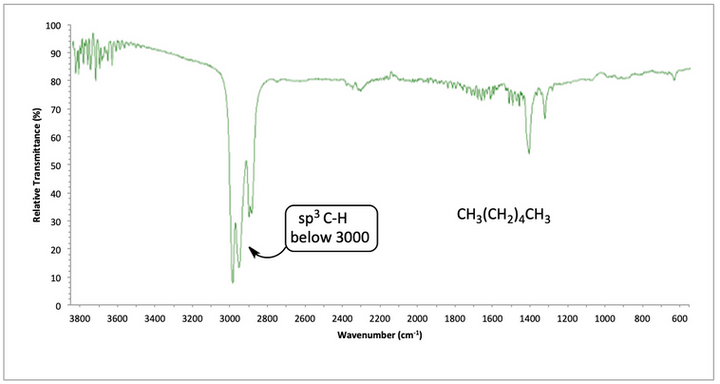
IR spectrum of hexane
For 1-hexene, we notice the sp3 C-H bonds of the alkane part below 3000. There are sp2 C-H bonds above 3000. Since there are sp2 C-H bonds, we know that there is some type of C=C. We see a regular alkene C=C at 1660.

IR spectrum of 1-hexene
For ethylbenzene, we see the sp3 and sp2 C-H bonds. When we see the sp2 C-H bonds right above 3000, we look to see what type of C=C we have. In this case, we see aromatic overtones below 2000 indicating an aromatic ring.

IR spectrum of ethylbenzene
IR active/IR inactive
The reason that infrared light causes a bond to vibrate is that the frequency of the IR light matches the resonance frequency of the bond. A bond must have a dipole moment in order to absorb IR light. If it does, the bond is said to be IR active. Not every molecular bond absorbs IR light and can be seen in an IR spectrum. Symmetrical bonds in the middle of symmetrical molecules do not change a dipole moment when they are stretched or compressed. These bonds are called IR inactive and do not absorb IR light.


IR active and IR inactive examples
For 2-octene, we see the sp3 and sp2 C-H bonds. When we look for what type of C=C is present, we look for the alkene peak at 1650 or aromatic overtones. We do not see either. An alkene C=C is present in the molecule, but it is absent in the IR spectrum because it is an internal double bond.

IR spectrum of 2-octene
1-Pentyne is a terminal alkyne (alkyne on the end of the molecule). The sp3 C-H bonds of the methyl group are below 3000. The sp C-H stretch is sharp and at 3300. The C≡C is weak but visible right around 2100.

IR spectrum of 1-pentyne
For 2-pentyne, there are sp3 C-H stretches below 3000. There are no sp C-H peaks because there is not a hydrogen atom on the C≡C. Also, since the C≡C is internal, it is pretty much IR inactive and absent from the IR spectrum. The sp CH peak at 3300 and the C≡C peak below 2200 go together. We usually do not see one without the other.
We see then, that internal C=C and C≡C are difficult to determine strictly from an IR spectrum.

IR spectrum of 2-pentyne
4. Circle the molecule below if its bond that is marked red is and IR ACTIVE bond.
CH3–CH3
CH3CH2–CH3
HC≡CCH3
H–O–H
O=C=O
C≡O
H–C≡N
H–C≡C–H
OH, NH, NH2
OH, NH bond stretches all appear around 3300. Alcohols have an obvious, very identifiable peak. In benzyl alcohol, we see the sp3 CH peak below 3000 and the sp2 CH peak above 3000. There is a strong, broad peak at 3300 for the alcohol OH. It is much broader than the sp CH peak. We also see the aromatic overtones.

IR spectrum of benzyl alcohol
For benzylamine, there are sp3 CH peaks below 3000 for the CH2 and sp2 CH peaks above 3000 for the aromatic ring. The aromatic overtones below 2000 confirm this. At 3300, we see a two-hump peak. This means there are two N-H bonds present (an NH2).

IR spectrum of benzylamine
Carbonyl compounds
The C=O, carbonyl, stretch is very easy to identify. It is usually the strongest peak in an IR spectrum. It is usually around 1700 but can range from the 1660s up to about 1800. When we see the carbonyl, we also look for secondary peaks that help us identify the functional group. Also, the frequency of the C=O stretch gives us information on the type of functional group it is. Be flexible with these frequencies. The below ranges are typical but vary slightly.
A conjugated C=O is one where a C=C is one bond removed from the C=O. It cannot be closer or farther away.

IR carbonyl frequencies
For butanoic acid, a regular carbonyl peak at 1710 appears. The secondary peak of a broad OH that is centered at 3000 and slowly tapers off indicates a carboxylic acid. The sp3 CH peak appears just above 3000 on top of the OH peak.

IR spectrum of butanoic acid
For pentanal, a carbonyl C=O peak appears at 1725. We also see two peaks near 2700 and 2800 to help confirm aldehyde.
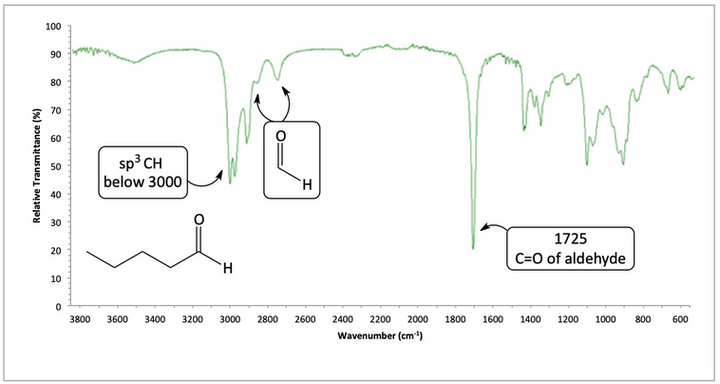
IR spectrum of pentanal
In acetone, there is a regular C=O at 1710. There are no secondary peaks that suggest carboxylic acid or aldehyde, so we conclude it is a ketone.

IR spectrum of acetone
For ethyl acetate, the carbonyl peak is high in the 1730s. This indicates ester. The two fairly strong secondary peaks at 1250 and 1050 confirm ester.

IR spectrum of ethyl acetate
For cyclopentanone, we see the sp3 CH peak below 3000. There is also a high carbonyl peak which could indicate an ester or maybe a ring-strained ketone. Normally when we analyze an IR structure with a high carbonyl frequency, we would be trying to determine if we have an ester or a ring-strained ketone. We can look at the fingerprint region to look for secondary peaks for an ester. There are not the two strong peaks around 1250 or 1050, so we lean towards a small ring that is a ketone.

IR spectrum of cyclopentanone
For acetamide, we see that the carbonyl peak is quite low in the 1660s indicating an amide. We look for secondary peaks at 3300 and find two N-H bonds. We also see sp3 CH peaks below 3000. It is fairly small since there are only three C-H bonds.

IR spectrum of acetamide
In acetophenone, we see sp2 and sp3 CH bonds. Since we have sp2 CH, we look for what type of C=C is present. We notice the aromatic overtones below 2000. We also see a carbonyl peak, but it is a little low in the 1680s. This tells us that our aromatic ring is next to the carbonyl so we can get a conjugated C=O.

IR spectrum of acetophenone
Other functional groups
In acetonitrile, the C≡N nitrile is the sharp peak just above 2200. C≡C IR peaks also show up near C≡N. We can tell this is not C≡C because C≡N shows up just above 2200 while C≡C is usually just below 2200. Additionally, we usually only see C≡C if it is at the end of a molecule (terminal alkyne). In that case, we also see the sp CH stretch at 3300, which is absent here.

IR spectrum of acetonitrile
For ethyl ether, we see the sp3 CH peak below 3000, but not much else. All other major peaks, like OH, C=O, etc. are missing. Since we don’t have many clues yet, we venture down into the fingerprint region and see a strong C-O peak at 1100 indicating ether.

IR spectrum of ethyl ether
Nitrobenzene shows the sp2 and the aromatic overtones of the benzene ring. With no other major peaks identified, we venture into the fingerprint region and see two strong, sharp peaks surrounding 1400. With both of them there, that indicates nitro, NO2.

IR spectrum of nitrobenzene
For N-methylaniline, we see the sp2 and sp3 CH peaks surrounding 3000. We also see the aromatic overtones indicating aromatic ring. We do see a one-hump peak at 3300. We know this is an N-H stretch or an sp CH stretch. It is fairly sharp. An OH stretch is usually broader and NH2 is two humps. If it was an sp CH stretch, we would also see the C≡C peak below 2200. Therefore, we know that we have an amine with one N-H bond.

IR spectrum of N-methylaniline
In chloroform, we see no major peaks so we venture into the fingerprint region. There, we see an unusually strong peak at 700 which indicates the C-Cl stretch.

IR spectrum of chloroform
5. Identify the functional group(s) indicated in each generic IR spectrum.
a)

b)

c)

d)

e)

f)

g)

h)

i)

j)

k)

l)

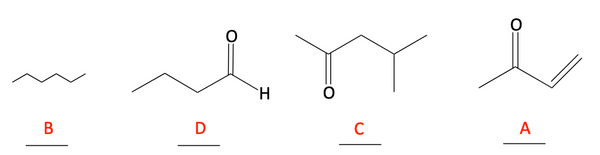
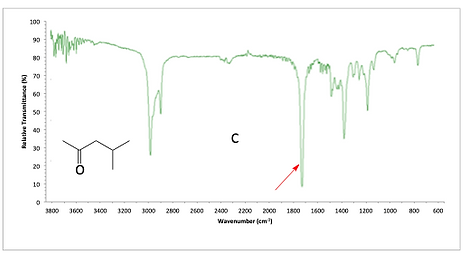
6. Match the following four compounds with their IR spectrum.


7. Match the following four compounds with their IR spectrum.


Answers
4. Circle the molecule below if its bond that is marked red is an IR active bond.

5. Identify the functional group(s) indicated in each generic IR spectrum.
a)
b)
c)
d)
e)
f)
g)
h)
i)
j)
k)
l)
6. Match the following four compounds with their IR spectrum.


7. Match the following four compounds with their IR spectrum.


