
Carbonyl Spectroscopy
Mass spectrometry
In mass spectrometry, carbonyl compounds like ketones and aldehydes often cleave at the carbonyl carbon atom. This cleavage produces a carbocation on the carbonyl carbon atom. This positive charge can be stabilized through resonance using the lone pair of the carbonyl oxygen atom.


Infrared Spectroscopy
Carbonyl compounds
The C=O, carbonyl, stretch is very easy to identify. It is usually the strongest peak in an IR spectrum. It is usually around 1700 but can range from the 1660s up to about 1800. When we see the carbonyl, we also look for secondary peaks that help us identify the functional group. Also, the frequency of the C=O stretch gives us information on the type of functional group it is. Be flexible with these frequencies. The below ranges are typical, but vary slightly.

IR carbonyl frequencies
For pentanal, a carbonyl C=O peak appears at 1725. We also see two peaks near 2700 and 2800 to help confirm aldehyde.

IR spectrum of pentanal
In the IR spectrum of butanoic acid, like that for most carboxylic acids, there is a carbonyl (C=O) peak at a normal 1710 cm-1 and a large, broad OH peak centered around 3000 cm-1 that slowly tapers off.

IR spectrum of butanoic acid
In acetone, like other ketones, there is a regular C=O at 1710. There are no secondary peaks that suggest carboxylic acid or aldehyde, so we conclude it is a ketone.
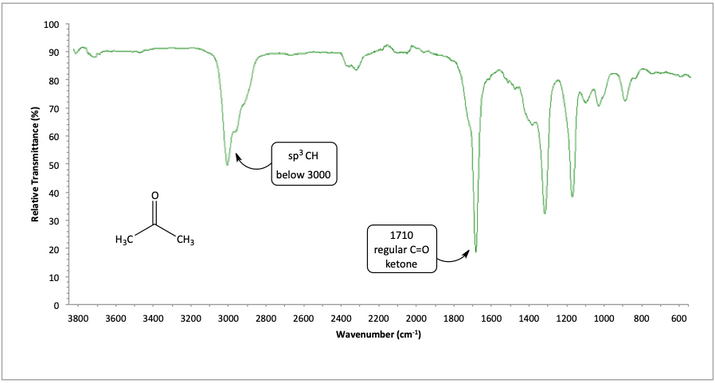
IR spectrum of acetone
For cyclopentanone, we see the sp3 CH peak below 3000. There is also a high carbonyl peak which could indicate an ester or maybe a ring strained ketone. We venture into the fingerprint region to look for secondary peaks for ester. There are not the two strong peaks around 1250 or 1050, so we lean towards a small ring that is a ketone.

IR spectrum of cyclopentanone
In acetophenone, we see sp2 and sp3 CH bonds. Since we have sp2 CH, we look for what type of C=C is present. We notice the aromatic overtones below 2000. We also see a carbonyl peak, but it is a little low in the 1680s. This tells us that our aromatic ring is next to the carbonyl so we can get a conjugated C=O.

IR spectrum of acetophenone
For the ester ethyl butyrate, notice the carbonyl stretch is at a higher frequency than normal. It is in the 1730’s. Also, when you have an ester, you can usually see a strong C-O stretch in the fingerprint region. You also sometimes see a strong O-C=O wag in the fingerprint region for esters.

IR spectrum of ethyl butyrate
For acetamide, we see that the carbonyl peak is quite low in the 1660s indicating an amide. We look for secondary peaks at 3300 and find two N-H bonds. We also see sp3 CH peaks below 3000. It is fairly small since there are only three C-H bonds.

IR spectrum of acetamide
1H and 13C NMR
Carbonyl carbon atoms appear between 150 and 200 ppm in a 13C NMR spectrum. A proton on an alpha carbon atom of a ketone or aldehyde appears around 2-2.5 ppm in a 1H NMR spectrum. The peak for an aldehyde proton appears between 9-10 ppm, and the peak for a carboxylic acid proton appears between 10-12 ppm.
